

Configuration Backup Reports in rConfig V8 Core
Configuration reports give you visibility into every automated backup operation in rConfig V8 Core. After reading this page, you can tell verbose reports apart from failure reports, read both correctly, and open them from the web interface, email, or the file system to find and fix failing devices.
When to use this
Section titled “When to use this”Reach for configuration reports when you need to confirm that a scheduled configuration download task backed up every device it was supposed to, or when you are chasing down which devices failed and why. Each task execution generates reports automatically, so you get backup health at a glance without opening individual device logs.
Prerequisites
Section titled “Prerequisites”- At least one scheduled configuration download task that has run at least once, since reports are generated per task execution.
- Access to the rConfig web interface, or to the report files on the server file system.
Report types and purpose
Section titled “Report types and purpose”rConfig generates two report types for every configuration download task. Each one suits a different monitoring need.
Verbose reports
Section titled “Verbose reports”Verbose reports document every device in a task, whether its backup succeeded or failed. They record each device’s connection status, the commands run, the output captured, and timing. This makes them the complete operational record for a scheduled backup, useful for audit trails and full traceability.
Use verbose reports to verify scheduled backups, confirming that all expected devices were contacted and all backups completed. When you are troubleshooting intermittent issues or validating a new task, the successful entries establish a baseline you can compare failures against.
Failure reports
Section titled “Failure reports”Failure reports list only the devices where a backup failed, dropping successful operations entirely. This focused view removes the noise of large backup runs so you can identify problem devices without scrolling past hundreds of successful entries.
Failure reports work best in stable environments where most backups succeed. Instead of reviewing a full verbose report each day, you monitor the failure report: if it is empty, every backup succeeded; if it is populated, those specific devices need attention. This exception-based approach scales as device counts grow.
How to access configuration reports
Section titled “How to access configuration reports”Reports are available in the rConfig web interface, by email, and on the file system.
Open reports in the web interface
Section titled “Open reports in the web interface”- Navigate to Config Tools → Reports in the rConfig web interface.
- Review the main reports view, which lists all generated reports by task, showing the report type (verbose or failure), the generation timestamp, and the task name. Reports appear in reverse chronological order, newest first.
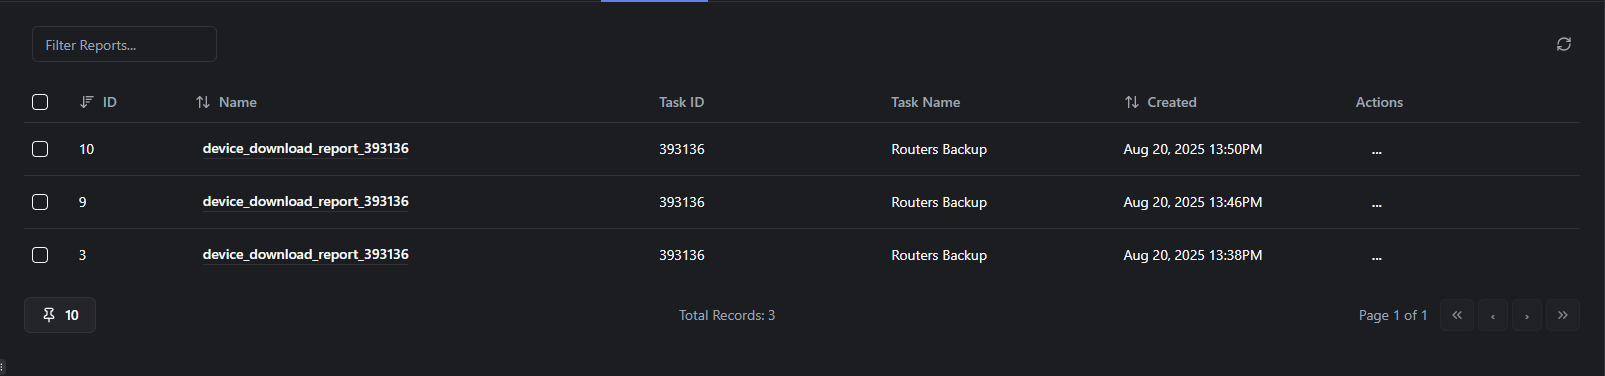
Main reports view: backup reports organised by task and type.
- Click any report link to open the full details, including per-device execution status, captured output, error messages for failed devices, and per-device timing.
Receive reports by email
Section titled “Receive reports by email”Reports are emailed to system users when a task completes, so you are notified of backup results without checking the interface. Each email includes a direct link to the full report in rConfig.
To stop receiving report emails, navigate to My Profile and adjust your report notification preferences to disable automatic email delivery.
Access reports on the file system
Section titled “Access reports on the file system”Reports are also written to the server file system at:
/storage/app/rconfig/reports/Files are organised by task and timestamp. Direct file system access suits backup and archival, integration with external log management systems, custom parsing scripts, and long-term retention in separate storage. It requires server-level permissions and is typically used by administrators for bulk operations rather than daily monitoring.
How to read each report
Section titled “How to read each report”Knowing what each report contains and how to interpret it makes operational monitoring and troubleshooting faster.
Verbose report structure
Section titled “Verbose report structure”A verbose report covers every device in the task in a structured layout you can scan quickly.
Report header information:
- Task name and description
- Execution timestamp
- Total device count
- Success count
- Failure count
- Execution duration
Per-device information:
- Device name and IP address
- Connection status (successful or failed)
- Commands executed
- Output captured from the device
- Execution time per device
- Error messages, if any
Verbose report: all successful
Section titled “Verbose report: all successful”When every device in a task backs up successfully, the verbose report confirms a clean run across the whole device population. Every device was reachable, credentials authenticated, commands ran without errors, and configurations were captured and stored.
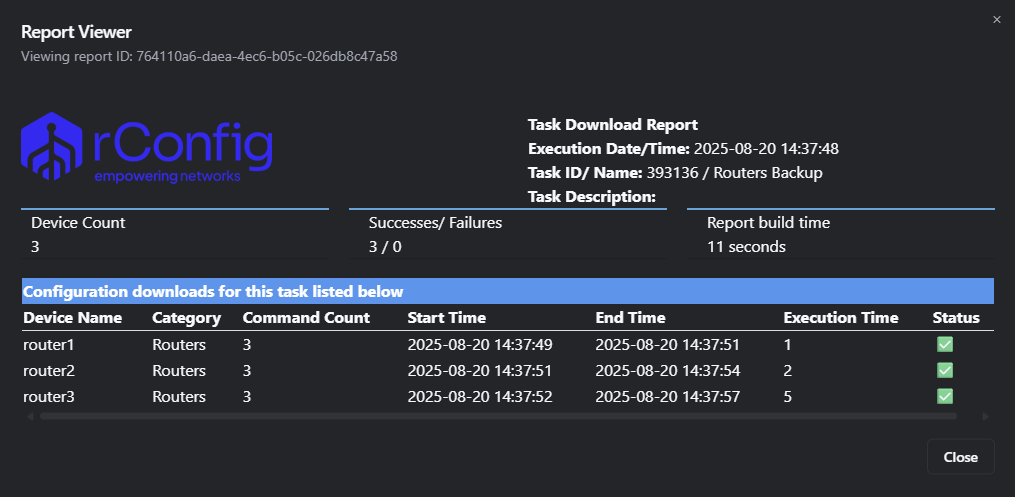
Verbose report: all devices backed up successfully.
No action is required. The task configuration is correct, connectivity is stable, and credentials are valid. The report stands as documentation that scheduled backups ran as intended.
Verbose report: some failed
Section titled “Verbose report: some failed”When some devices fail and others succeed, the verbose report gives you comparative context. The successful devices show that task configuration, credentials, and connectivity are broadly correct, while the failures point to device-specific issues.
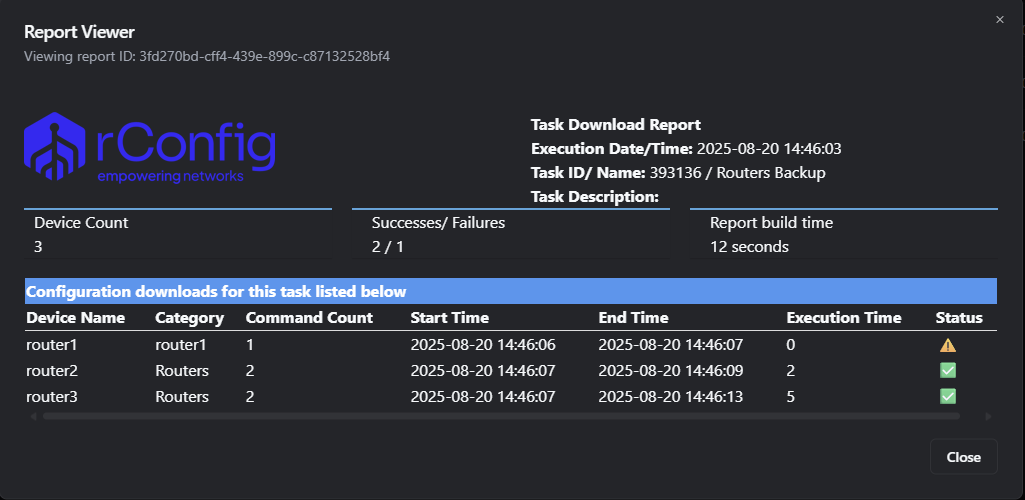
Verbose report: mixed success and failure.
Investigate the failed devices specifically. Common causes include a device being unavailable (network issue or powered off), a device-specific credential problem (password changed on that device), or a device-specific connection issue (SSH disabled, management interface down). The successful devices in the same task prove that task-level configuration is correct.
Failure report structure
Section titled “Failure report structure”A failure report contains only the devices that failed, so you can identify problem devices without scrolling past successful ones.
Report header information:
- Task name
- Execution timestamp
- Total failure count
- Link to the full verbose report (for complete context)
Per-failed-device information:
- Device name and IP address
- Failure reason (connection timeout, authentication failure, command error)
- Error message details
- Attempted connection protocol
- Execution timestamp
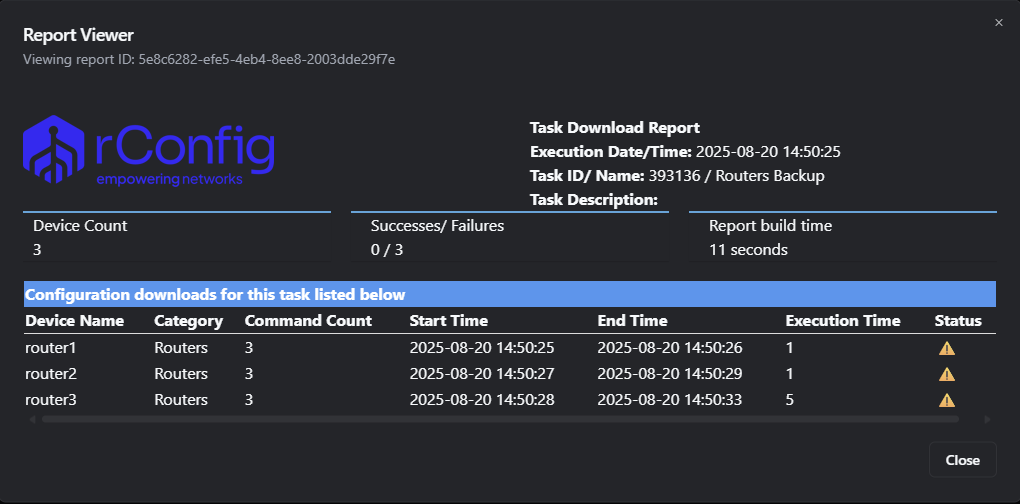
Failure report: only failed devices shown for focused troubleshooting.
Each listed device needs remediation. Because failure reports are built for exception-based monitoring, an empty report means every backup succeeded, and a populated one tells you exactly which devices to investigate.
How reports are generated
Section titled “How reports are generated”Knowing how and when reports generate helps you anticipate availability and troubleshoot generation issues.
Automatic generation
Section titled “Automatic generation”Reports generate automatically when a configuration download task completes, whether all devices succeeded, some failed, or all failed. Every task execution produces both a verbose report and a failure report. The sequence is:
- The task finishes execution (all device jobs complete).
- rConfig aggregates results from every device job.
- The verbose report is generated, covering all devices.
- The failure report is generated, covering only failed devices.
- Both reports are stored in the database and on the file system.
- Email notifications are sent to configured recipients.
Report storage and retention
Section titled “Report storage and retention”Reports are stored both in the rConfig database (for web UI access) and as formatted files (for email distribution). Storage grows linearly with task frequency and device count, so larger environments with frequent backups generate more reports and need more capacity. Reports remain accessible for retrospective failure analysis, trend identification, and audit documentation unless purged by your configured retention policy.
Why isn’t my report appearing?
Section titled “Why isn’t my report appearing?”If a task completes but no report shows in the reports interface, the report generation job may have failed. Check the Horizon queue manager for failed report jobs, review the application log for errors during generation, and confirm your user has permission to view reports.
Why didn’t I receive the report email?
Section titled “Why didn’t I receive the report email?”If the report is visible in the UI but the email never arrived, the cause is usually email delivery rather than report generation. Verify your SMTP configuration in the settings reference, test email connectivity with the rConfig email test feature, confirm your profile holds the correct email address, and check your spam or junk folder.
Why is the report data incomplete?
Section titled “Why is the report data incomplete?”If a report is missing devices or shows the wrong status, the task may have been still running when you opened it. Wait for it to fully complete, refresh the report view, and confirm completion in the Horizon queue manager before re-running the task.
What’s next
Section titled “What’s next”- Set up scheduled backup tasks → to generate these reports automatically.
- Understand configuration backups → to see how rConfig captures device configs.
- Monitor jobs in the Horizon queue manager → to watch backup execution in real time.